

 français
 English
 Deutsch
 español
 العربية
 中文
中文
RÉSUMÉ Les opérateurs de réseaux de distribution sont confrontés à des défis croissants liés à la qualité de l'énergie (PQ). EDP Distribuição au Portugal a développé un programme complet de surveillance de la qualité du produit pour relever ces défis. Cet article décrit la plate-forme et la méthodologie de surveillance PQ de pointe utilisées par EDP, et présente les résultats de la surveillance des sous-stations HT/MT et MT/BT. Les actions d'amélioration du réseau de distribution et le support aux clients sensibles sont également abordés, en mettant en avant l'intégration de technologies avancées telles que les filtres d'harmoniques actifs et les générateurs de var statiques de YT Electric pour améliorer le PQ.
EDP Distribuição (EDP D) est une société du groupe EDP Energias de Portugal. Au Portugal, EDP D exploite environ 83 000 km de lignes et câbles Haute Tension (HT) et Moyenne Tension (MT), 400 sous-stations HT/MT et MT/MT et 62 000 transformateurs utilisés pour abaisser la tension vers les utilisateurs Basse Tension (BT), avec une capacité électrique totale d'environ 18 700 MVA (chiffres se référant à fin 2009), soit la taille du réseau de distribution BT d'environ 136 000 km. Fin 2009, EDP D comptait environ 6,1 millions de clients du réseau de distribution.
En raison de l'étendue des zones rurales du pays, environ 80 % des réseaux HT et MT sont de type aérien. Cela crée de fortes contraintes sur la qualité de service (QoS) en période de conditions météorologiques défavorables, notamment lors des tempêtes et de leurs conséquences ultérieures.
En tant qu'opérateur du réseau de distribution portugais, pleinement engagé à fournir un haut niveau de QoS, EDP D surveille systématiquement ses réseaux, en particulier ceux des niveaux MT et BT, depuis 2001.
Les campagnes de surveillance PQ associées ont été réalisées conformément aux normes recommandées NP EN 50160 et également selon un Code national de régulation de la QoS, qui fixe les différents indicateurs et les niveaux de qualité minimum correspondants que l'Opérateur de Distribution doit garantir à tous ses clients dans les différentes tensions. niveaux.
EDP D a développé un programme complet de surveillance de la qualité de la qualité afin de relever tous les défis actuels. Ce programme permet de caractériser le PQ dans le réseau de distribution et à l'entrée des clients, et d'améliorer l'exploitation et la maintenance du réseau de distribution, d'accompagner les clients et de signaler le PQ aux régulateurs.
Plateforme et méthodologie de surveillance PQ
Pour atteindre l'objectif de fournir les données nécessaires à la réalisation de toutes les analyses, une méthodologie a été mise en œuvre, comprenant l'installation d'enregistreurs PQ, d'infrastructures de communication (collecte de données), de systèmes de stockage et de logiciels d'analyse. La topologie de base de la plateforme de surveillance PQ est présentée dans la figure 1.
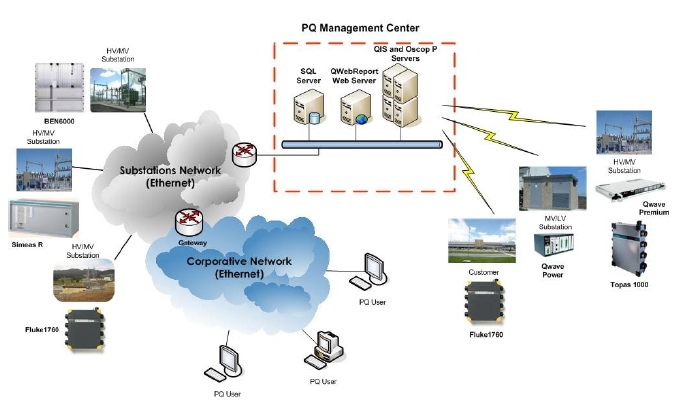
Figure 1. Plateforme de surveillance PQ d'EDP.
The program is mainly based on 3 months PQ monitoring campaigns in HV/MV and MV/LV substations. These campaigns are performed to assure the requirements of the Portuguese QoS Regulation Code. Recently, EDP D has adopted a strategy of PQ continuous monitoring in all new HV/MV substations. In addition, PQ monitoring at some complaining customers is also carried out.
Systematic Monitoring Campaigns in Substations
Voltage measurements are performed in MV busbars of HV/MV substations, using about 26 portable PQ recorders per quarter. For MV/LV secondary substations there are performed measurements of voltage and current in about 42 LV busbars, per quarter, also with portable PQ recorders.
Continuous Monitoring in HV/MV Substations
According to the EDP D’ strategy to improve the PQ, since 2007 fixed PQ recorders with DFR features have been installed in all new HV/MV substations and in those submitted to a major refurbishment. So far, devices from Siemens (Simeas R) and Qualitrol (BEN 6000), with remote communications by Ethernet, modem and serial port, have been installed. Currently, the new acquisitions are only class A devices according to the IEC 61000-4-30 standard.
Customers Monitoring
Some customers are supported by point PQ monitoring in order to perform an accurate characterization of the PQ supplied and help identify improvement actions. Examples of these customers are sensitive industries and LV microgenerators. Typically, a portable class A PQ recorder is installed for monitoring during a month.
PQ Data Collection and Processing
For systematic monitoring campaigns in substations and customers monitoring, data are collected locally every month, and inserted in an SQL database. For continuous monitoring, the data are collected and stored automatically in the SQL database by scheduled actions.
After each quarter, PQ data of the systematic campaigns are processed in order to issue PQ overview reports to the Portuguese regulator. These reports are performed using a dedicated web based application (QWebReport). All PQ data are also submitted to analysis in order to support operation and maintenance.
PQ monitoring results from the HV/MV and MV/LV substations analyzed in the systematic campaigns during the quadriennium 2006-2009 are briefly presented.
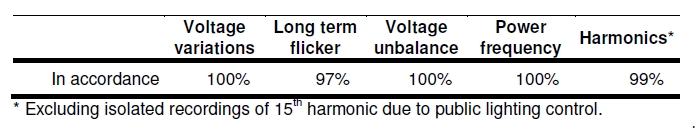
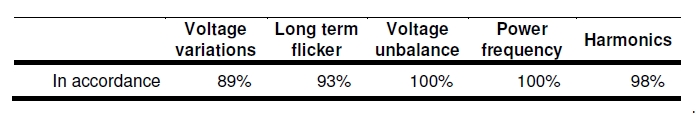
During the quadriennium, all the HV/MV substations were analyzed. In the Table 1 are presented PQ results (continuous phenomena) from the 539 MV busbars, in a total of 5819 monitoring weeks. These results are about the percentage of weeks in accordance to the NP EN 50160.
Table 1.
 .
.
The most part of flicker severity “not in accordance”, both in HV/MV and MV/LV substations, is associated to the occurrence of voltage dips.
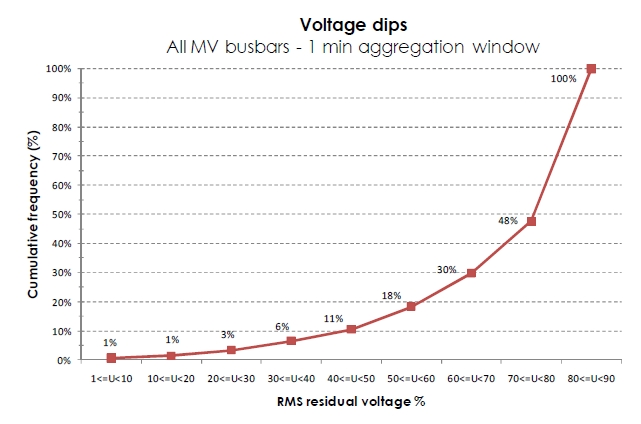
Figure 2. Voltage dips overview – Cumulative frequency.
In the Figure 2 is shown an overview of the voltage dips recorded in the same MV busbars. The voltage dips characterization was performed as defined in the Annex IV of the Portuguese QoS Regulation Code.
During the quadriennium, at least 2 MV/LV substations per municipality were analyzed. In the Table 2 are presented PQ results (continuous phenomena) from the 580 LV busbars, in a total of 5792 monitoring weeks. These results are about the percentage of weeks in accordance to the NP EN 50160.
Table 2.
Distribution Network
Voltage Variations The main PQ parameter “not in accordance” was voltage variations monitored at LV busbar of MV/LV substations. For the most part, there are situations associated to slight exceeded 110% of nominal value, in a short time. In some cases, situations were identified with origin in voltage regulation in upstream HV/MV substation or proximity of MV distributed generation.
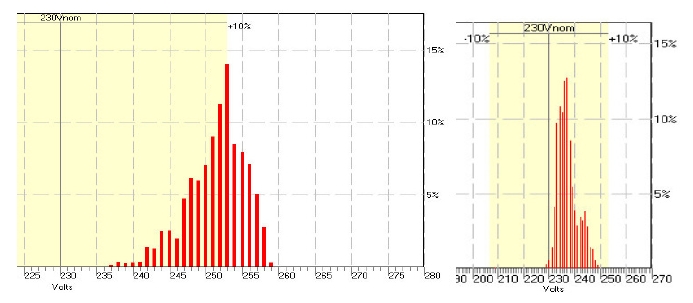
Figure 3. rms voltage values, before and after to decrease one point from tap changers.
Finally, some changes were performed on MV/LV transformer tap changers. For the case study presented in Figure 3, one notices that there were some recorded values slightly above the standard threshold.
After network analysis, the strategy to correct the rms voltage values was to decrease one point from tap changers, as shown in the same Figure. In sequence of the analysis, in some neighbouring MV/LV transformers the same change was made.
Flicker
The second case study is about the voltage flicker recorded in two MV busbars of a HV/MV substation. The substation topology is characterized by two transformers, one busbar for each transformer.
As shown in the Figure 4, the values of voltage flicker in busbar #2 significantly exceeded the limits defined in NP EN 50160.
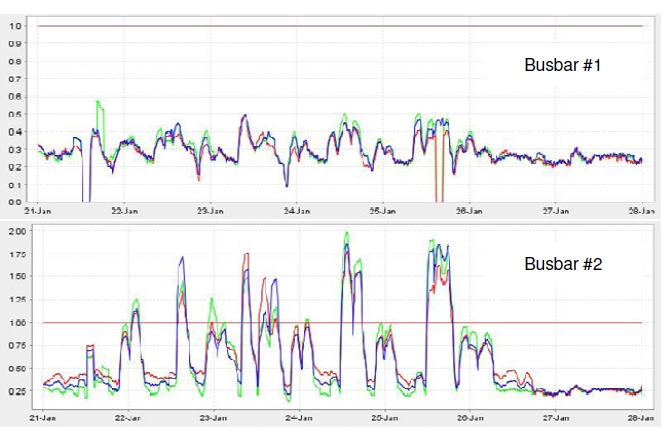
Figure 4. Voltage flicker (Plt) in busbars #1 and #2 (worst week) and the permissible limit.
In MV busbar #2 some customers were identified as potentially PQ polluters, including foundry (arc furnace), metal processing, recycling of scrap and stone industries.
The flicker level decreases with the increasing network short-circuit power. Therefore, a strategy to mitigate the voltage flicker, immediately and without any investment, was changing the busbar topology, namely, connecting the MV busbars. However, the advantages and disadvantages of this reconfiguration have been carefully studied.
This way we achieved an increase of 58% in short-circuit power in both MV busbars and approximately 16% in a foundry industry.
An additional monitoring in the HV/MV substation validated the procedures in order to mitigate voltage flicker throughout network, to regulatory values.
Harmonics
As a result of these systematic campaigns, EDP D has identified some problems in the distribution network, which deserve careful attention, namely those related to the 5th voltage harmonics levels at particular points along the MV and LV grids.
Resonance Harmonic:
The resonant harmonic hr, based on fundamental frequency impedances, is defined as follows [1]:
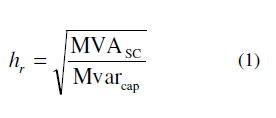
where hr = resonance harmonic
MVASC = system short-circuit MVA
Mvarcap = Mvar rating of capacitor bank
The resonant harmonic for the MV busbars of all HV/MV substations is calculated from the equation (1).
When the resonant harmonic is approximately close to the 5th harmonic voltage, studies are developed to prevent high voltage distortion based on the identification of potential resonance conditions in most probable network configurations.
In order to deal with the identified problems, to understand their main causes and, as much as possible, to foresee their solution, EDP D has been developing harmonic power-flow analysis models as well as harmonic state estimation models. These have been integrated into DPlan, an analysis and optimization program which evaluates and foresees future trends on harmonics phenomena in the grid, as well as their impact in PQ [2].
Once the non-linear loads have been estimated and the network has been characterized (for the selected frequencies), it is possible to simulate the harmonic behaviour of the system under topology and parameters changes. For example, it is possible to simulate the effect of switching-on capacitor banks, changing tap positions of transformers, connecting busbars and/or reconfiguring the HV or the MV network.
In a case study, the filter function “Harmonic voltage distortion” from a MV network was applied. It was concluded that the increase in the 5th harmonic in MV busbar #1 happens when the capacitor bank (CB) 1, connected to busbar #1, is switched on and the CB 2, connected to busbar #2, is switched off, coinciding still higher values of 5th harmonic with the periods in which the load is lower (off-peak hours). For another busbar, the conclusion is similar.
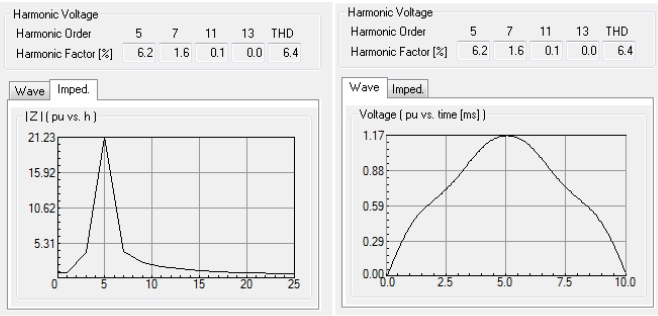
Figure 5. Harmonic voltage results in MV busbar #1.
The impedance curve depicted in the Figure 5 shows the resonance behaviour for the 5th harmonic.
The harmonic distortion problem was being caused by resonance created by the substation capacitor banks in the MV busbar. This resonance was magnifying the 5th harmonic component in the currents from all the customers on this system, causing high voltage distortion levels.
Optimizing the schedule of both CB, also associated to the management of reactive power in the network, reduces the 5th harmonic voltage to regulatory values.
Events
EDP D has been working on the reduction of the fault incidence on overhead networks in order to decrease the number and duration of voltage dips and short interruptions. Therefore, some actions have been considered, like preventive and predictive maintenance strategies, adjustment of the insulation level to the specific local conditions of the network and implementation of new overhead technologies, such as covered conductors. At the operation level, some actions have been also considered, like optimization of the protection systems, supply of sensitive customers by shorter circuits, from busbars with lower fault incidence or higher voltage levels, and increasing HV network robustness.
Malgré les défis actuels, il a été possible de développer un programme complet de surveillance PQ, comprenant plusieurs semaines de surveillance de plus d'un millier de jeux de barres MT et BT. En outre, on s'attend à une augmentation des points de mesure avec les récents développements de la plateforme de surveillance PQ de l'EDP, notamment avec la stratégie de surveillance continue dans les sous-stations HT/MT. Sur la base des résultats de la surveillance PQ, EDP D a adopté plusieurs mesures visant à développer ses actions dans le réseau de distribution, telles que l'atténuation de la distorsion harmonique, principalement la 5ème harmonique, l'atténuation du scintillement induit par les charges industrielles, la réduction des défauts en aérien. réseaux afin de diminuer l'incidence des creux de tension et des coupures courtes, ainsi que l'ajustement des niveaux de tension dans certains jeux de barres BT. Les campagnes de suivi PQ accompagnent également les clients sensibles qui souhaitent adopter des solutions de vaccination et améliorer la fiabilité de leur production.


 réseau ipv6 pris en charge